Advanced Remote Sensing
Advanced Remote Sensing was a course I took as part of the module „Methods in Geoinformatics“. The course provided a broad overview of Remote Sensing techniques in theory and practise. In this entry, you can find a selection of the contents I learned and worked on. A second course from this module was on Geodata Aquistion, where I learned about satellite systems, orbits, UAVs, precision etc. The Advanced Remote Sensing course was more concerned with the processing of the aquired data, while the Geodata Aquistion course was rather concerned with the data aquisition as such. There can be overlaps, though.
The Copernicus Programme
The Copernicus programme is the European Union’s flagship Earth observation initiative. It uses a combination of satellite data (e.g., Sentinel satellite data) and ground-based sensors to monitor the environment and changes on our planet. The programme collects and analyzes this information to provide accurate and timely services. These services support efforts to tackle environmental challenges, such as climate change and natural disasters. By offering valuable data, Copernicus helps governments, organizations, and citizens make informed decisions. Ultimately, it aims to promote a more sustainable and resilient future for all.
The Sentinel satellite family is open and free, and can be accessed via the EO Browser (Sentinel Hub).
- Sentinel 1: radar (all-weather, day and night imagery for oceans, ice and land, emergency response)
- Sentinel 2: high-resolution multispectral (for land cover and vegetation)
- Sentinel 3: radar altimeter, imaging radiometer, and imaging spectrometer (for oceans and land)
- Sentinel 4: spectrometer (air quality)
- Sentinel 5p/5: spectrometer (atmospheric pollution/air quality)
- Sentinel 6: radar altimeter (sea-surface height)
sentinel
noun. from Middle French sentinelle, from Old Italian sentinella,
from sentina vigilance, from sentire to perceive, from Latin
(Merriam Webster)
GEOBIA
Object Representation
Vector model
- clear boundaries
- unique and unabmbigous content
- allows queries
- stores interpretations, facts
Image Representation
Raster model
- no boundaries (but pixles)
- no semantic content, only spectral values
- allows different interpretations
- stores (pseudo-continuous) measurements
Passive and Active Systems
Passive Systems
- can only measure when it’s light (day-time)
- measure light and reflectance
- affected by clouds, weather, atmosphere, …
- used for e.g., vegetation
- e.g., optical cameras or thermal sensors
Active Systems
- can measure during day and night
- actively send signals e.g. radar wave that returns
- less affected by weather
- used for e.g., navigation
- e.g., RADAR, LiDAR
Recap on Physics
Spectroscopy
= the study of light and radiation by matter.
Each object has a unique wavelength-pattern, the so-called spectral signature. With the help of the spectral signature, surface measurements can be taken. They can get influenced by spectral reflectance. Reflectance is a key element in remote sensing measurements, as some circumstances can have an effect on the outcome: e.g. leaf-moisture-effect (when the water absorbs light and reflectance is reduced), the age/health of a plant, the soil background, phenology, …

Colours and Bands
In remote sensing, spectral information—often visualized through colors—plays a crucial role in interpreting observed phenomena. Satellite sensors record data in distinct spectral bands, each corresponding to a specific range of wavelengths, such as blue, green, red, and near-infrared. These bands are not limited to visible colors (like yellow, which is typically not a standalone band), but extend into non-visible regions like infrared. By combining multiple bands into composite images, analysts can extract information that goes beyond human visual perception.
For example, the near-infrared (NIR) band is highly sensitive to vegetation and is commonly used to assess plant health, monitor drought stress, or differentiate crop types. These capabilities make remote sensing a powerful tool for environmental monitoring, agriculture, and land use analysis.
Stefan-Boltzmann-Law
The Stefan-Boltzmann Law states that the total energy radiated per unit surface area of a blackbody is proportional to the fourth power of its absolute temperature (T⁴). Mathematically:
E = σT⁴,
where E is the emitted energy, T is temperature in Kelvin, and σ is the Stefan-Boltzmann constant.
Or is simpler words: It tells us that the hotter the body, the more energy is emitted.
In remote sensing, this law is crucial for interpreting thermal infrared data. It allows satellites to estimate the surface temperature of Earth or other objects by measuring their emitted radiation. The hotter the object, the more energy it emits — a principle remote sensors rely on to detect and monitor heat patterns, wildfires, urban heat islands, and more.
Wien’s Displacement Law
Wien’s Displacement Law states that the wavelength at which a blackbody emits the most radiation is inversely proportional to its absolute temperature. Mathematically:
λ_max = b / T,
where λ_max is the peak wavelength, T is the temperature in Kelvin, and b is Wien’s constant.
Or in simpler words: It tells us that the hotter the body, the shorter the wavelength of the maximum radiation.
In remote sensing, this law helps determine the dominant wavelength of thermal radiation from an object, which shifts with temperature. For example, hotter objects emit peak radiation at shorter wavelengths. This is essential for designing and calibrating sensors to detect the correct thermal range — such as distinguishing between vegetation, soil, or volcanic activity based on their temperature and emitted wavelengths.
The Doppler Effect
The Doppler Effect describes the change in frequency or wavelength of a wave in relation to an observer moving relative to the source. When the source moves toward the observer, the frequency increases (wavelength shortens); when it moves away, the frequency decreases (wavelength lengthens). Mathematically (for electromagnetic waves):
Δf = (v / c) · f₀,
where Δf is the frequency shift, v is the relative velocity, c is the speed of light, and f₀ is the original frequency.
In remote sensing, the Doppler Effect is used in radar and satellite systems (e.g., Synthetic Aperture Radar, Doppler radar, or satellite altimetry) to measure motion — such as wind speed, ocean currents, or ground displacement. It enables precise tracking of velocity and direction of moving objects or surfaces from space.
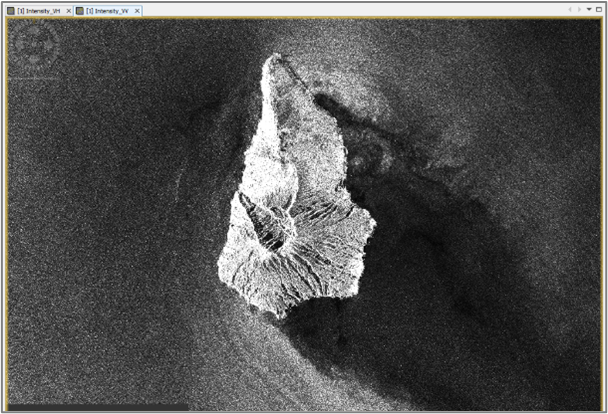
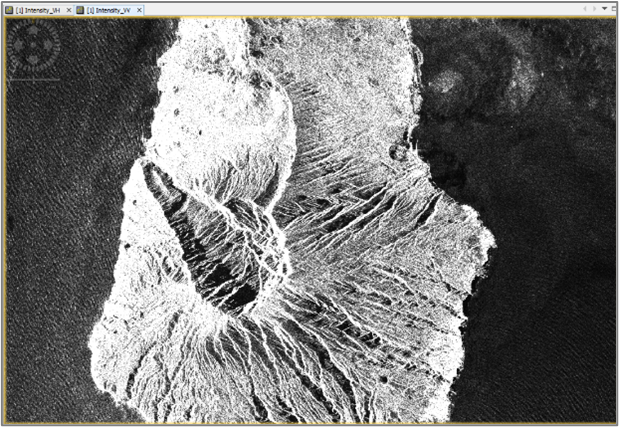
RADAR (active)
Radar (Radio Detection and Ranging) is a remote sensing technology that uses radio waves to detect and measure the distance, speed, and characteristics of objects. It works by emitting microwave signals toward a target and then measuring the backscattered signal that returns to the sensor. The time delay and strength of this returned signal help determine the object’s location, shape, and movement. Radar is widely used in earth observation, including monitoring surface deformation, measuring ocean waves, detecting ships, and mapping terrain, especially in areas with frequent cloud cover or darkness, where optical sensors are limited.
LiDAR (active)
LiDAR (Light Detection and Ranging) is a remote sensing technology that uses laser pulses to measure distances with high precision. It works by emitting short bursts of laser light toward a surface and then measuring the time it takes for the reflected light to return to the sensor. By calculating this time delay, LiDAR creates detailed 3D models of the Earth’s surface, including elevation, vegetation structure, and built environments. It is widely used for terrain mapping, forestry analysis, urban planning, and autonomous vehicles, and is especially effective in penetrating vegetation canopies to reveal the ground beneath.
Typical Steps in a Remote Sensing Workflow
- Define the Objective
Understand what you want to observe or analyze—e.g., land cover mapping, vegetation health, urban growth, or disaster assessment. - Data Acquisition
Select and collect suitable remote sensing data:- Choose appropriate sensors (optical, radar, LiDAR, thermal, etc.) based on your objective.
- Determine the spatial, spectral, temporal, and radiometric resolution needed.
- Obtain satellite images, aerial photos, or drone data.
- Preprocessing
Prepare raw data for analysis by:- Radiometric correction: Adjusting sensor errors and atmospheric effects.
- Geometric correction: Aligning images to real-world coordinates (geo-referencing).
- Noise reduction: Removing clouds, shadows, or sensor noise.
- Data fusion: Combining multiple data sources if needed.
- Image Enhancement and Visualization
Improve image quality for better interpretation through:- Contrast stretching, filtering, or color composites.
- Creating false-color images to highlight specific features.
- Image Classification / Feature Extraction
Convert pixel data into meaningful categories:- Supervised classification: Using training data to guide classification.
- Unsupervised classification: Letting algorithms group data without prior labels.
- Extract specific features (e.g., water bodies, vegetation, urban areas).
- Accuracy Assessment & Validation (details below)
Evaluate the quality and reliability of your classification or analysis by comparing it with reference data or ground truth. - Data Analysis & Interpretation
Analyze the processed data to extract useful information:- Change detection, trend analysis, or thematic mapping.
- Integrate with other datasets (GIS, field surveys).
- Reporting & Application
Present findings in reports, maps, or dashboards for decision-makers, researchers, or the public. Use results for environmental monitoring, resource management, planning, or emergency response.
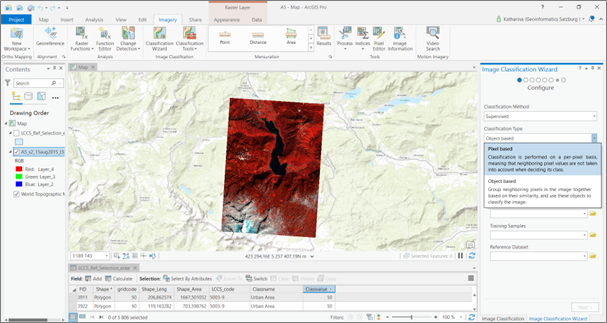
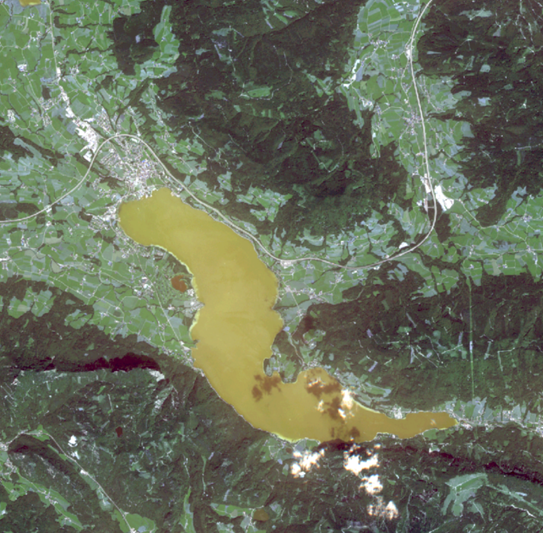
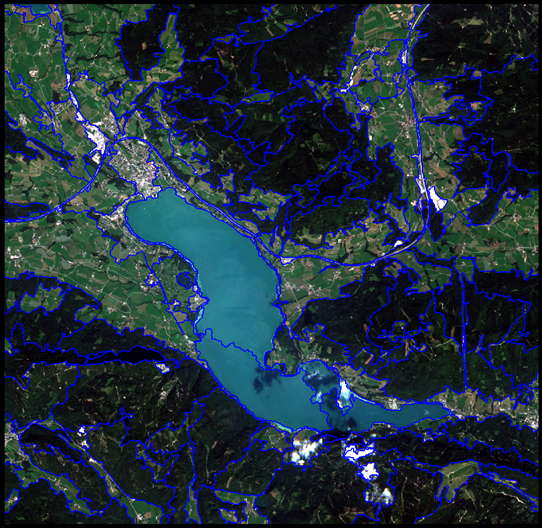
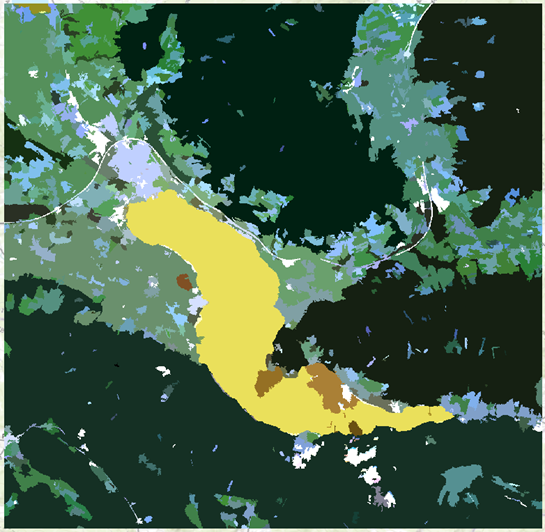
Example of a satellite image from lake Mondsee in Austria with a Segmentation and a Classification.
Accuracy Assessment & Validation
Accuracy assessment is a crucial step in remote sensing to evaluate how reliable and valid the classified or derived data is. It helps determine whether the results can be trusted for further analysis or decision-making.
Quality Assurance Framework
A commonly used approach is the QA4EO framework (Quality Assurance for Earth Observation), which provides guidelines to ensure both technical and user-oriented validation of Earth observation products. It promotes the use of standard, traceable procedures for comparing EO data against reference data.
Understanding Accuracy
Accuracy reflects how well the classification or measurement matches the real-world conditions. It’s a key indicator of the usefulness and credibility of remote sensing outputs.
Two main types of agreement are considered:
- Site-specific agreement: Accuracy at specific ground-truth locations.
- Non-site-specific agreement: Broader accuracy metrics across the whole dataset.
Types of Classification Errors
- Error of Omission (False Negative): A reference class (e.g., forest) is missed in the classification.
- Error of Commission (False Positive): A class is wrongly assigned to a pixel that doesn’t belong to it.
Sampling Methods for Accuracy Assessment
To assess accuracy effectively, appropriate sampling strategies are used to select validation points:
- Simple Random Sampling: Randomly selects points across the area.
- Stratified Random Sampling: Ensures a minimum number of samples for each class or region of interest.
- Systematic Sampling: Samples are taken at regular intervals (e.g., every 1 km).
- Systematic Non-Aligned Sampling: A grid-based method where samples are evenly distributed but offset, avoiding strict alignment.
- Cluster Sampling: Collects samples in groups (clusters), useful for analyzing nearby or related objects.
Error Matrix (Confusion Matrix)
An error matrix compares the classified data with ground-truth data to summarize accuracy. It shows:
- Correct classifications (diagonal cells)
- Errors of omission and commission (off-diagonal cells)
From the matrix, we can calculate:
- Overall Accuracy: Percentage of total correct classifications.
- User’s Accuracy: Reliability of a given class from the user’s point of view.
- Producer’s Accuracy: Probability that a real-world class was correctly classified.
Kappa Statistics
The Kappa coefficient measures classification accuracy while accounting for chance agreement. It is a more robust statistic than overall accuracy alone.
- Values range from -1 to 1
- 1 = perfect agreement
- 0 = no better than random
- < 0 = worse than random
This structured approach helps ensure that remote sensing products are trustworthy, repeatable, and scientifically sound, enabling confident use in environmental monitoring, urban planning, agriculture, and more.
Classification & Knowledge Representation
= classification is the process of converting contiuous variables into nominal/categorical classes
Semantic Classification
grouping nominal-scale variables
- follows taxonomy/ontology
- hierarchical
Statistical Classification
grouping continuous variables
- parametrisised (class-limits)
- classifiers (intervalls, quantiles, breaks, …)